Channel Analysis
Specifics - Channel Analysis:
There have been many upgrades to channels over the years. From Escon to Ficon to the new z/17 architecture, each upgrade
has improved the performance of transfering data. The I/O Processor (IOP) was added to manage I/O operations, thus giving
more processing power back to the CPU to improve overall performance.
Helpful ESAMON screens/ESAMAP reports:
- ESACHAN - Channel Performance Analysis - shows how the current DASD channels are performing.
- ESACHNH - HiperSocket Channel Report - shows how the utilization of HiperSocket channels.
- ESAIOP - I/O Processor Analysis - shows information about the I/O processing units.
ESACHAN - Shows the channel performance

Channel Util% - This shows the channel utilization for the LPAR and all the LPARS to which it is connected. If
the channel utilization is over 30%, consider faster channels or moving data.
If the total utilization for all of the connected LPARS is over 40%, consider adding channels, moving to faster
channels or moving data to other channels. Alerts should be set for these percentages.
Data Unit/Work Unit/Bus Cycles Pct - This shows the percent busy for the channel. This should
really stay under 40%. Again, alerts can be set for these. The Total Reads and Writes per second shows the total
for the CEC so only one LPAR on each CEC needs to provide the information.
Note: This report can be used to verify issues such as mixing ESCON and FICON channels or a channel
being overworked.
ESACHNH - Shows the HiperSocket channel performance
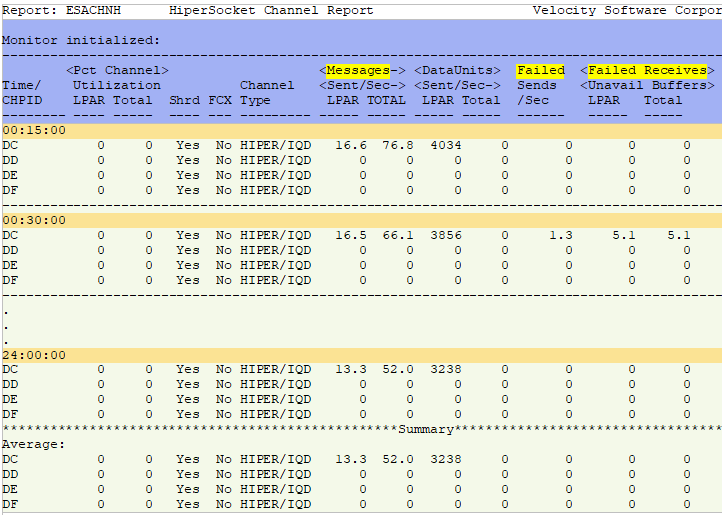
Channel Type - This shows the type of channel.
Messages Sent/Sec LPAR/TOTAL - This shows the number of messages sent per second on this path (LPAR) and on
this path for all LPARs (TOTAL). This can be viewed to track message volume trends.
DataUnits Sent/Sec LPAR/Total - This shows the number of data units sent per second on this path (LPAR) and on
this path for all LPARs (Total). This can be viewed to track message volume trends.
Failed Send/Sec - This shows unsuccessful attempts to send messages. Watch for errors.
Failed Receives Unavail Buffers LPAR/Total - This shows the number of times transmissions failed due to
unavailable receive buffers for this LPAR (LPAR) and for all LPARs (Total). Watch for errors.
ESAIOP - Shows the I/O processor unit performance
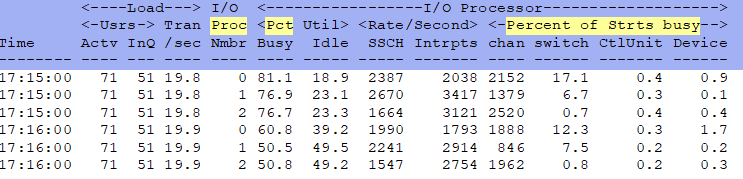
I/O Proc Nmbr - This shows the processor number (and how many there are).
I/O Processor Pct Busy - This shows the I/O processor utilization. If high, it may indicate a problem,
especially if there is high Pend time from ESADSD2.
Percent of Strts busy - This shows the percentage of SSCH busy time in each step of the process.
Back to top of page
Back to Flow Chart main page